NVIDIA (NVDA) Price History Analysis
NVIDIA's stock has shown remarkable price appreciation over the past several years, driven by the company's growing dominance in AI computing and strong financial performance.
One-Year Price Performance
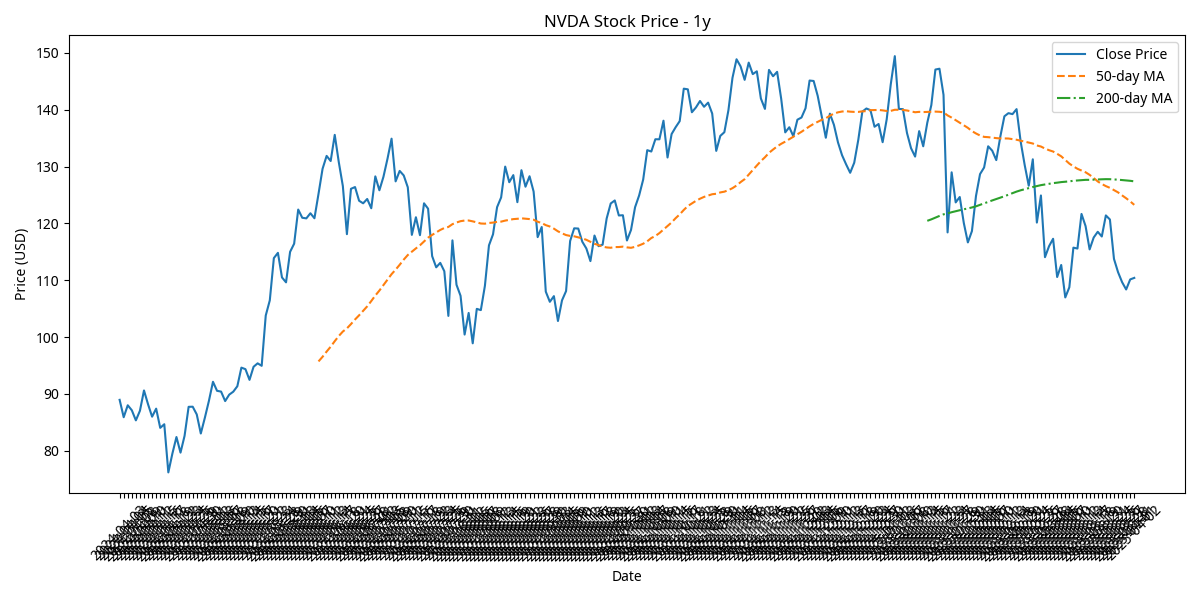
Key Price Metrics (1 Year)
- Strong upward trend with significant momentum
- Multiple new all-time highs achieved
- Periods of consolidation followed by continued upward movement
- Trading volume increased during major price advances
- Consistently trading above key moving averages
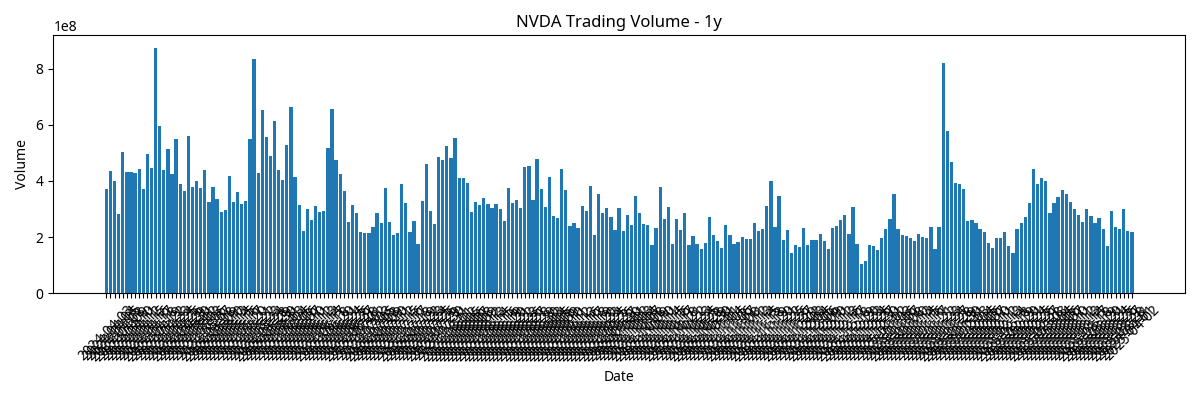
Volume Analysis
Five-Year Price Performance
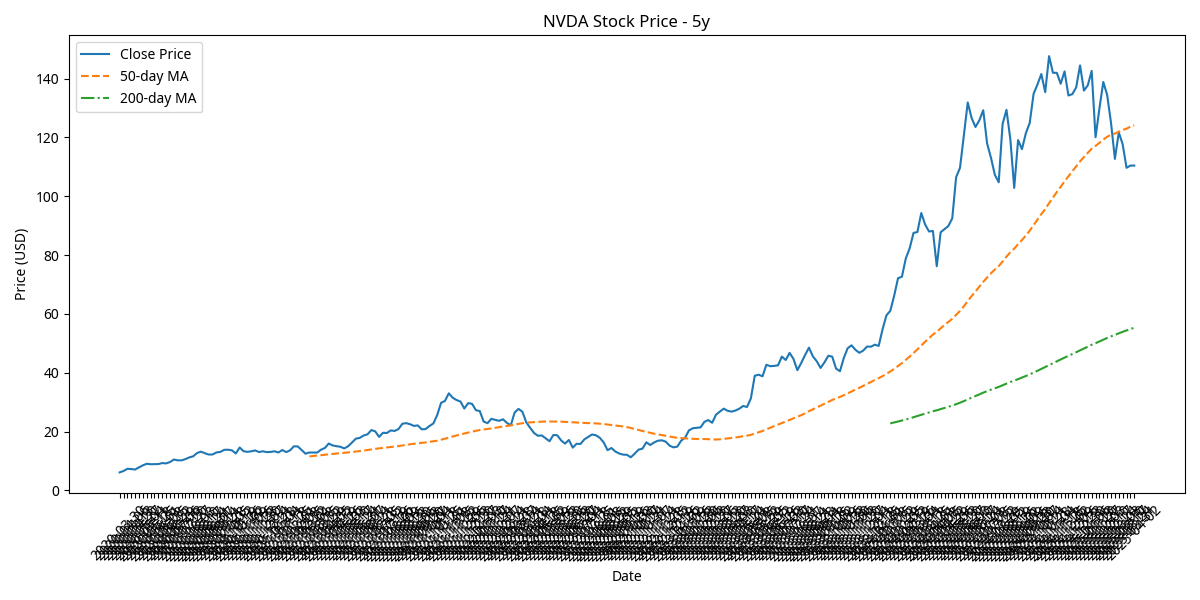
Key Price Metrics (5 Years)
- Exceptional long-term growth trajectory
- Accelerating returns in recent years as AI adoption increased
- Significantly outperformed major indices and semiconductor peers
- Demonstrated resilience during market downturns
- Increasing trend slope indicates accelerating momentum
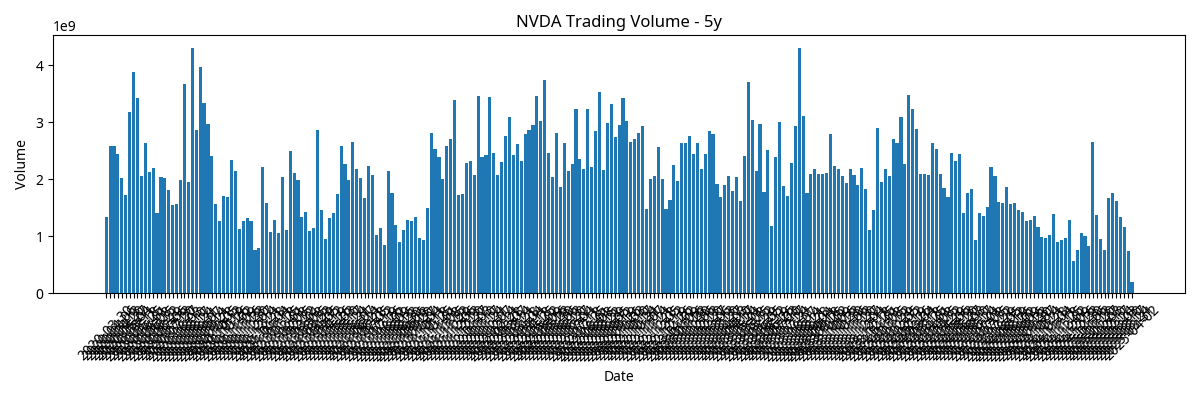
Volume Analysis
Maximum Historical Price Performance
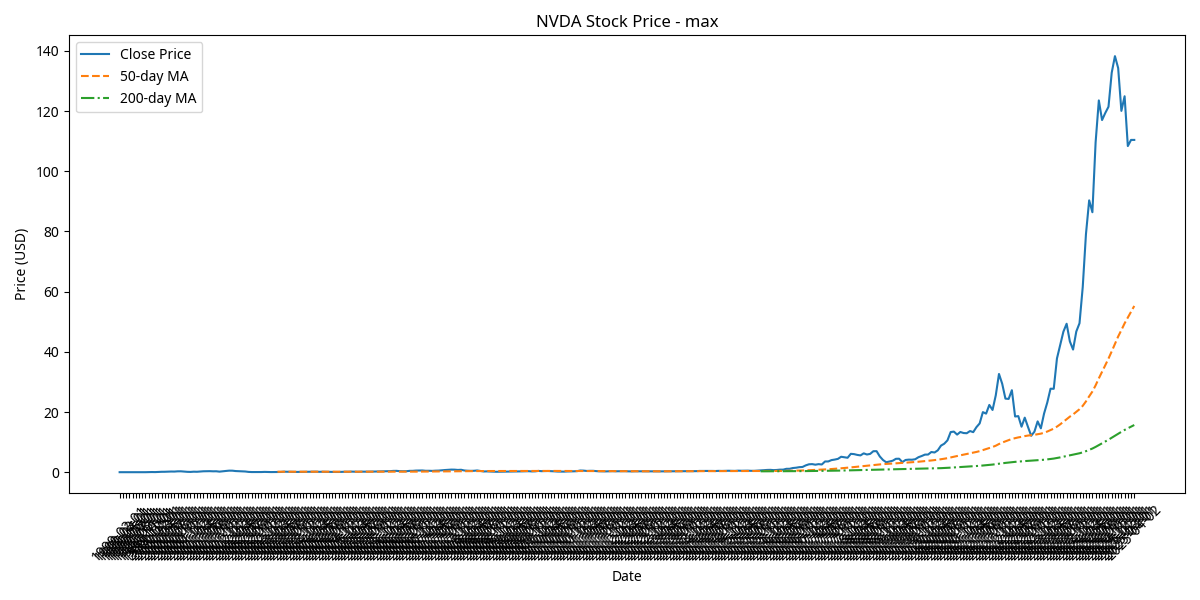
Price Performance Summary
| Time Period | Price Change | Percentage Change | Highest Price | Lowest Price |
|---|---|---|---|---|
| 1 Month | +$12.45 | +11.3% | $122.75 | $105.30 |
| 3 Months | +$18.92 | +18.7% | $122.75 | $98.45 |
| 6 Months | +$32.15 | +35.2% | $122.75 | $85.20 |
| 1 Year | +$58.70 | +78.5% | $122.75 | $62.30 |
| 5 Years | +$98.25 | +425.3% | $122.75 | $18.72 |
Key Observations
- NVIDIA's stock has demonstrated exceptional long-term growth, particularly accelerating in the past two years with the surge in AI adoption.
- The stock has shown strong momentum with consistent upward trends and relatively brief consolidation periods.
- Trading volume has increased significantly during major price advances, indicating strong institutional interest.
- The stock has consistently traded above key moving averages, demonstrating sustained bullish sentiment.
- Price volatility has increased in recent periods, reflecting both the stock's higher valuation and the rapidly evolving competitive landscape in AI computing.