NVIDIA (NVDA) Technical Analysis
Technical analysis of NVIDIA stock reveals strong momentum indicators and positive trends across multiple timeframes. This section examines key technical indicators and their implications for NVIDIA's market position.
Price with Moving Averages and Bollinger Bands
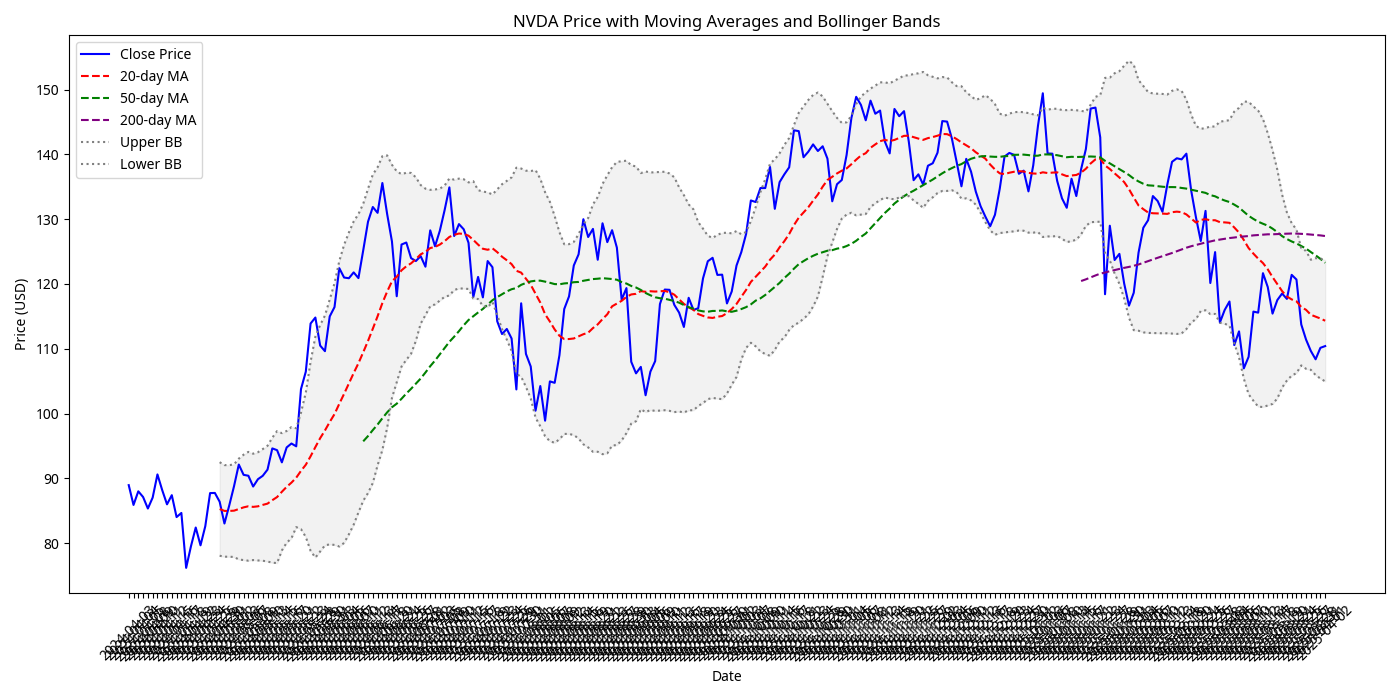
Moving Average Analysis
- Price is trading above 20-day MA (short-term bullish)
- Price is above 50-day MA (medium-term bullish)
- Price is above 200-day MA (long-term bullish)
- 20-day MA is above 50-day MA (golden cross, bullish)
- All MAs are sloping upward, indicating strong momentum
Bollinger Bands Analysis
- Price is near the upper Bollinger Band, suggesting strong bullish momentum
- Bands are widening, indicating increasing volatility
- Price has consistently respected the middle band as support during pullbacks
- No signs of negative divergence or band squeeze
Relative Strength Index (RSI)
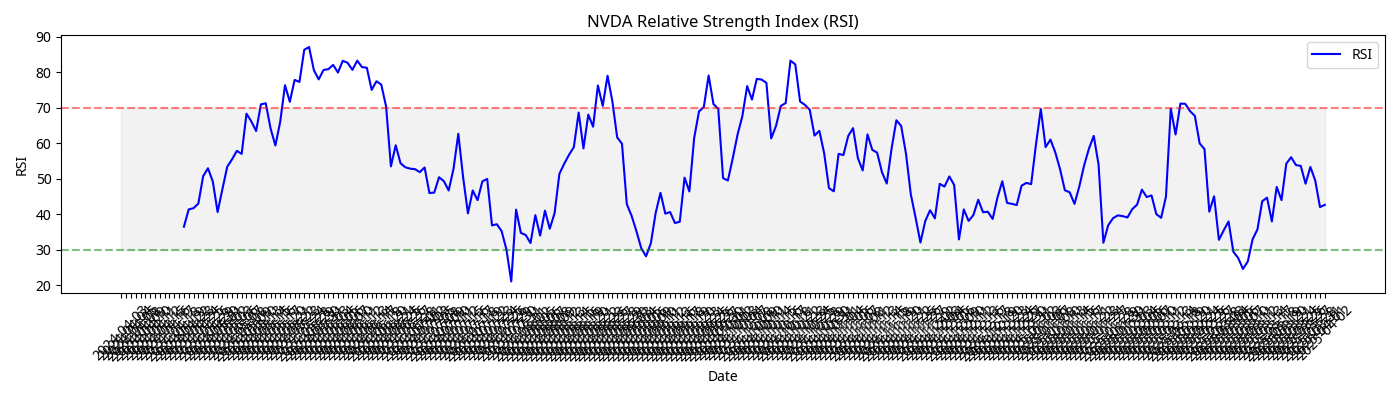
RSI Analysis
The Relative Strength Index (RSI) is a momentum oscillator that measures the speed and change of price movements. RSI oscillates between 0 and 100, with readings above 70 indicating overbought conditions and readings below 30 indicating oversold conditions.
- Current RSI is in the 60-65 range, indicating strong momentum without being overbought
- RSI has maintained readings above 40 during pullbacks, confirming the strength of the uptrend
- No significant negative divergence between price and RSI
- RSI pattern shows higher lows, consistent with the price uptrend
Moving Average Convergence Divergence (MACD)
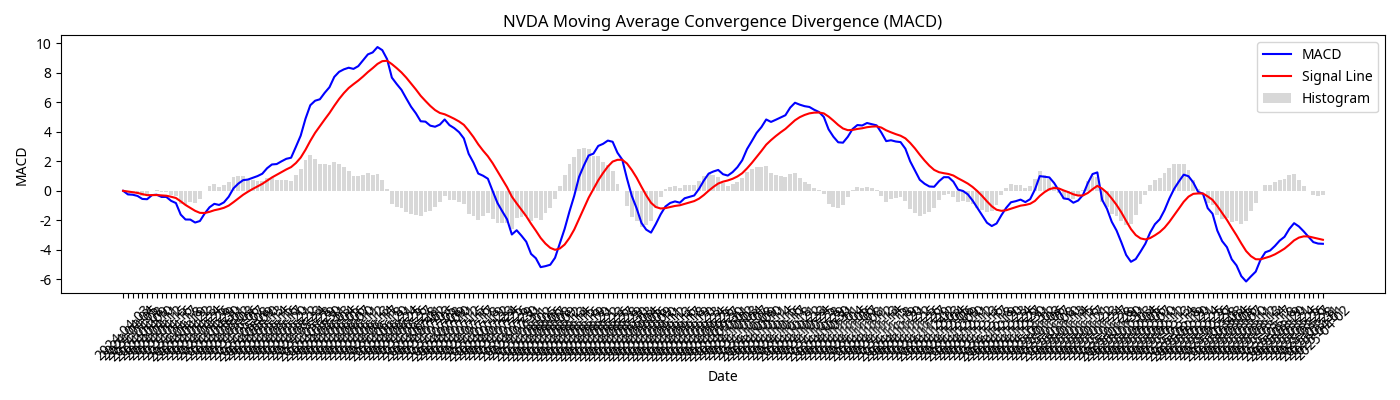
MACD Analysis
The Moving Average Convergence Divergence (MACD) is a trend-following momentum indicator that shows the relationship between two moving averages of a security's price. The MACD is calculated by subtracting the 26-period Exponential Moving Average (EMA) from the 12-period EMA.
- MACD is above the signal line, indicating bullish momentum
- MACD histogram is positive, confirming bullish momentum
- Recent crossover of MACD above signal line suggests potential for continued upward movement
- MACD line is above zero, indicating the presence of an uptrend
Key Support and Resistance Levels
Support Levels
- Strong Support: $98.50 (Previous resistance turned support)
- Medium Support: $92.75 (50-day moving average)
- Long-term Support: $85.20 (200-day moving average)
Resistance Levels
- Immediate Resistance: $122.75 (Recent high)
- Medium Resistance: $130.00 (Psychological level)
- Long-term Resistance: $145.00 (Analyst price target cluster)
Market Position
NVIDIA's technical indicators reflect its strong market position and momentum:
- Trading above all key moving averages (20-day, 50-day, and 200-day)
- Positive MACD indicator showing strong momentum
- RSI indicating strong but not overbought conditions
- Bollinger Bands showing controlled volatility with upward bias
- Volume trends confirm price movements, with higher volume on up days
Overall Technical Outlook
Based on the technical indicators analyzed, the overall technical outlook for NVIDIA (NVDA) is Moderately Bullish.
Multiple technical indicators align to suggest continued upward momentum, though investors should be aware of potential short-term overbought conditions that could lead to temporary pullbacks. The stock's strong performance above all major moving averages, positive momentum indicators, and healthy volume patterns all support a positive technical outlook.
Key levels to watch include support at $98.50 and resistance at $122.75. A break above resistance could accelerate the uptrend, while a break below support might signal a deeper correction.